S&P500 Daily Action Areas & Price Targets 7/8/26

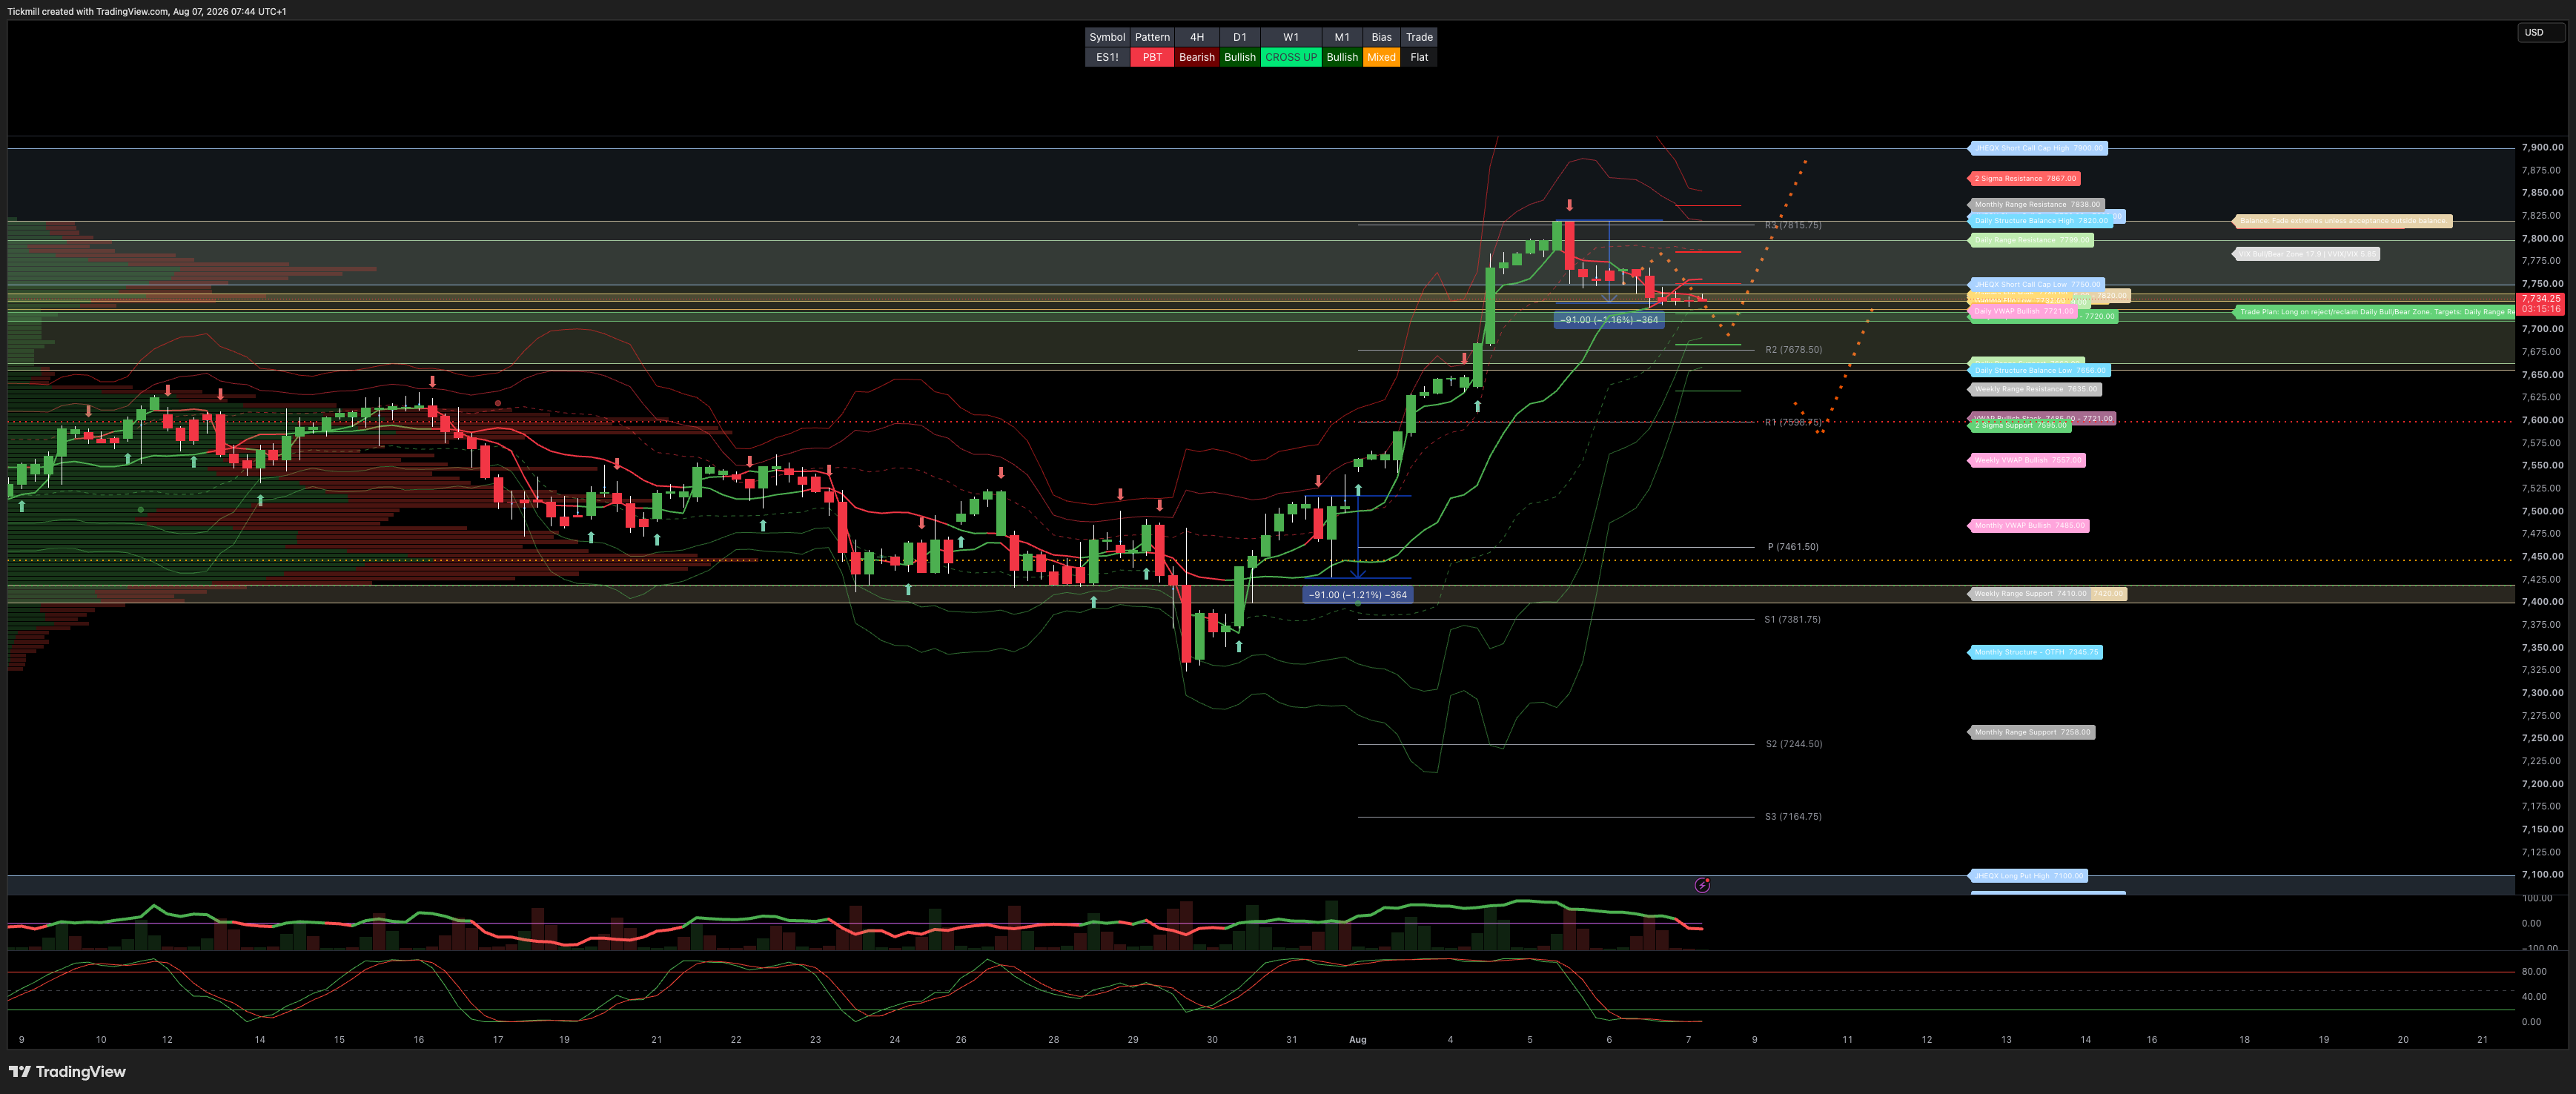
S&P500 Daily Action Areas & Price Targets 7/8/26
***QUOTING ES1! FOR CASH US500 EQUIVALENT LEVELS, SUBTRACT POINT DIFFERENCE***
WEEKLY BULL BEAR ZONE 7400/20
WEEKLY RANGE RES 7635 SUP 7410
MONTHLY RANGE RES 7838 SUP 7258
JHEQX Q3 Collar Short Call Cap: ~7,750 – 7,900 - Long Put Strike: ~7,050 – 7,100 (approx. 5% downside protection) Short Put Strike: ~5,950
DEC2025 OPEX to DEC2026 OPEX is 945 points giving us a range of [5889,7779]
SPX PUT/CALL RATIO 1.15 (The numbers reflect options traded during the current session.) A put-call ratio below 0.7 is generally considered bullish, and a put-call ratio above 1.0 is generally considered bearish.
GS Flow Desk: large S&P 31Aug 7000/7950 strangle in roughly $20mm vega / $115mm premium …My Read – classic “big convexity versus carry” trade: either someone paid a lot to own a wide August move, or someone got paid a lot to bet that the S&P stays comfortably inside the 7000–7950 corridor
DAILY VWAP BULLISH 7721
WEEKLY VWAP BULLISH 7557
MONTHLY VWAP BULLISH 7485
DAILY STRUCTURE - BALANCE - 7820/7656
WEEKLY STRUCTURE - OTFH - TBC
MONTHLY STRUCTURE - OTFH - 7345.75
Balance: This refers to a market condition where prices move within a defined range, reflecting uncertainty as participants await further market-generated information. Our approach to balance includes favouring fade trades at the range extremes (highs/lows) while preparing for potential breakout scenarios if the balance shifts.
One-Time Framing Higher (OTFH): This represents a market trend where each successive bar forms a higher low, signalling a strong and consistent upward movement.
One-Time Framing Lower (OTFL): This describes a market trend where each successive bar forms a lower high, indicating a pronounced and steady downward movement.
DAILY BULL BEAR ZONE 7710/20
GAMMA FLIP 7732/40
DELTA FLIP 7723
DAILY RANGE RES 7799 SUP 7663
2 SIGMA RES 7867 SUP 7595
VIX BULL BEAR ZONE 17.9 (VVIX / VIX) 5.85
TRADES & TARGETS
LONG ON REJECT/RECLAIM DAILY BULL BEAR ZONE TARGET DAILY RANGE RES > AUG RANGE RES 7838
***ADDITIONAL SETUPS & TARGETS HIGHLIGHTED ON THE CHARTS***
(I FADE TESTS OF 2 SIGMA LEVELS ESPECIALLY INTO THE FINAL HOUR OF THE NY CASH SESSION AS 90% OF THE TIME WHEN TESTED THE MARKET WILL CLOSE ABOVE OR BELOW THESE LEVELS)
GOLDMAN SACHS FICC & EQUITY TRADING DESK VIEWS
Market Colour — Index Lower, Breadth Better, Mag7 / Momentum Drag, and Earnings Still Doing the Heavy Lifting
US equities ended Thursday modestly lower and near the worst levels, but the index tape understated a much healthier breadth picture underneath. The S&P 500 fell 17bps to 7,723, while S&P ex-Mag7 rose 215bps, with 6 of 11 sectors positive. The weakness was concentrated in mega-cap / momentum / AI-adjacent leadership, while broader cyclicals and defensives held up better.
The key read:
The index paused because Mag7 / Comm Services / high-beta momentum / data centers lagged, but the average stock and S&P ex-Mag7 had a much better day. This is still a broadening tape, not a broad risk-off tape.
1. US Market Snapshot
Asset / Index | Move | Close / Level |
|---|---|---|
S&P 500 | -0.17% | 7,723 |
S&P ex-Mag7 | +2.15% | — |
NDX | -0.83% | 29,487 |
SOX | -1.4% | — |
Russell 2000 | -0.59% | 3,019 |
VIX | — | 15.8 |
Materials | +1.54% | — |
Healthcare | +1.34% | — |
Comm Services | -2.39% | — |
High Beta Momentum / GSPRHIMO | -2.94% | — |
Data Centers / GSTMTDAT | -1.93% | — |
The divergence is stark:
\text{S&P 500} = -0.17\% \quad \text{vs.} \quad \text{S&P ex-Mag7} = +2.15\%
That is not a typical broad selloff. It is a leadership pause / rotation day.
2. Flow: Buyers Still Present
Flow was not risk-off.
Asset Managers
Asset managers finished net buyers, driven by:
Macro products
Tech
Supply was seen in:
Staples
Hedge Funds
Hedge funds finished modestly net buyers, driven by:
Macro products
Financials
This is consistent with the broader tactical view: investors are not de-risking broadly after the ATH push; they are rotating and selectively adding exposure.
3. Leadership Rotation: Broadening Beneath the Index
The market was weaker at the headline level because mega-cap / AI / momentum leadership lagged:
NDX underperformed.
SOX fell.
Comm Services was weak.
High Beta Momentum fell nearly 3%.
Data Centers fell nearly 2%.
But broader S&P ex-Mag7 rallied strongly. That suggests the market is absorbing leadership fatigue by rotating into non-Mag7 segments rather than fully selling risk.
The tape has shifted from:
Mag7-led index reboundMag7-led index rebound
to:
Mag7 digestion + ex-Mag7 catch-upMag7 digestion + ex-Mag7 catch-up
That is a constructive broadening signal if it persists.
4. After-Hours Tech: Mixed, but Expectations Matter More Than Beats
After-hours Tech earnings were mixed-to-weak in several high-expectation names.
Company | After-hours Move | Read |
|---|---|---|
SNDK | -4% | FQ1 revenue / EPS guidance merely in line |
WDC | -8% | Beat and guide, but below high buyside bar |
APP | -22% | Missed revenue / EBITDA; Q3 revenue guide below midpoint |
HUBS | -9% | Lowered FY guide |
DASH | Flat | Revenue / GOV in line; EBITDA better |
EXPE | +10% | Beat-and-raise |
The important takeaway: after the sharp re-risking rally, “in line” is not enough in crowded or recently re-rated Tech.
This fits recent reactions:
AMD down despite headline beat
PINS lower despite revenue acceleration
SNDK / WDC punished despite not disastrous prints
APP / HUBS punished for misses or guide-downs
EXPE rewarded for a clean beat-and-raise
The tape is bullish, but selective.
5. EPS Season: Stronger Than Expected, with AI Infrastructure Driving a Large Share
Q2 earnings remain the strongest support for equities.
Key numbers:
S&P 500 EPS Metric | Current Tracking |
|---|---|
Headline EPS growth including mega-cap tech equity gains | 45% y/y |
EPS growth excluding “other income” from mega-cap tech equity investments | 26% y/y |
Median S&P 500 EPS growth | 12% y/y |
Consensus median EPS growth entering season | 9% y/y |
Share of S&P EPS growth from AI infrastructure stocks | Roughly one-third |
This is the central reason desks remain tactically bullish. Even stripping out mega-cap tech’s equity investment gains, earnings growth is strong at 26%.
The median company is also beating expectations:
12% median EPS growth>9% pre-season consensus12% median EPS growth>9% pre-season consensus
That means earnings strength is not only a Mag7 accounting story, though AI infrastructure is still a major contributor.
6. Siemens: Messy Shape, Strong Electrification, Softer Automation
Siemens’ Q3 print was mixed in composition.
Positives
Smart Infrastructure / electrification was strong.
Q3 orders beat by 13%.
SI orders rose +42% organic versus consensus +24%.
Sales growth was in line.
Margins were strong in both DI and SI.
Free cash flow was very strong, beating by 50%.
SI guidance was upgraded for growth and margins.
EPS pre-PPA guidance raised.
Negatives
Automation / Digital Industries was lighter versus whispers.
DI orders missed consensus by 1%.
DI orders were far below Goldman’s estimate, around -10%.
EPS guidance upgrade was only in line with consensus, limiting upward revision pressure.
Key Siemens Numbers
Metric | Result / Guide |
|---|---|
Q3 Orders | 13% beat |
SI orders organic | +42% vs +24% consensus |
DI orders | -1% vs consensus; much weaker than GSe |
SI sales | +13% vs +10% consensus |
DI sales | +10% vs +9% consensus |
DI margin | 18.7% vs 18.3% consensus |
SI margin | 19.9% vs 18.9% consensus |
FCF | 50% beat |
EPS pre-PPA guide midpoint | €11.35 vs €10.90 prior |
Consensus EPS pre-PPA | Around €11.30 |
Read-through: electrification remains robust, but factory automation recovery is not as clean as bulls wanted. The print supports industrial electrification / grid demand but may not drive large consensus upgrades.
7. Rheinmetall: Divisional Beat, but Guidance / Backlog Questions Matter
Rheinmetall formally cut FY sales guidance to reflect lost F126 sales, consistent with the earlier disclosed “up to €300m” impact.
The Q2 operational detail was strong in key divisions:
Division | Beat |
|---|---|
Weapons & Ammo | 13% beat |
Vehicle Systems | 34% beat |
But the concern is backlog / outlook disclosure.
The slide now shows:
>€100bn backlog at year-end
Previously after Q1, the same slide showed:
Around €135bn
The lost F126 order explains roughly €12bn, but there is still an unclear ~€23bn gap.
This is the issue investors will focus on:
€135bn−€12bn=€123bn€135bn−€12bn=€123bn
But updated indication is:
>€100bn>€100bn
Leaving roughly:
€23bn€23bn
not clearly explained.
Read-through: defense demand remains strong operationally, but backlog visibility / order conversion questions may weigh on the stock.
8. Swiss Re: Headline Beat Driven by L&H and Lower Cat
Swiss Re delivered a 10% net income beat, driven entirely by Life & Health.
Group
Net income beat: 10%
Insurance revenue: 1% miss
P&C
Insurance revenue: 2% miss
Combined ratio: 74%
Consensus combined ratio: 81%
Big headline beat driven by lower catastrophe losses
Cat benefit / provisions delta was about 7 percentage points, exactly explaining the difference versus consensus
CorSo revenue in line
Life & Health
Strong net income beat
Driven by US$107m of positive experience variances in Q2
Read-through: quality of the P&C beat may be debated because it is cat-driven, while L&H looks genuinely strong.
9. NN Group: OCG Beat, Solvency Beat Mostly Methodology
NN Group had a decent headline print, but the quality of the solvency beat is important.
Metric | Result |
|---|---|
OCG beat | 6% |
OCG beat excluding €30m one-off | 3% |
Solvency beat | 5 percentage points |
The company updated bank methodology, adding +10 percentage points to solvency. This was offset by model / assumption changes and market effects.
So the solvency beat appears largely bank-methodology related, not purely organic capital generation.
Read-through: operationally a modest beat; solvency optics are better, but investors may adjust for methodology.
10. Deutsche Telekom: Solid, Ex-US Unchanged, Buyback Upside
Deutsche Telekom delivered a solid set of numbers.
Germany
In line overall
Decent mobile KPIs
Fixed net adds light
Guidance
Raised to reflect higher TMUS guide
DT ex-US outlook unchanged
Reiterated EBITDA
Raised FCF to €20bn from >€19.8bn
Street was at prior guide
Buyback
DT announced an additional buyback facility of up to €3bn, on top of the existing up to €2bn plan.
Street expectations:
€2bn modeled for 2026
€2.75bn modeled for 2027
Read-through: clean enough numbers, with capital return support. The incremental buyback should be well received, although ex-US operating outlook is unchanged.
11. Cross-Asset / Market Implications
Earnings Remain the Anchor
The most important macro-equity fact remains that Q2 EPS growth is tracking well above expectations.
Even excluding mega-cap tech equity investment gains:
\text{S&P EPS Growth} = 26\% y/y
That supports the tactical bullish stance.
But Tech Expectations Are High
After-hours reactions show that investors are demanding more:
In-line guidance is punished.
Buyside bars matter more than consensus.
Misses / guide-downs are punished severely.
Beat-and-raise still works.
Breadth Is Improving
S&P ex-Mag7 up 215bps while the headline index fell is a major broadening signal.
Momentum Is Still Fragile
High Beta Momentum down 294bps and Data Centers down 193bps show the market has not fully repaired the prior factor damage.
Europe Read-Through
Siemens supports electrification / grid demand but automation is not clean.
Rheinmetall shows defense strength but backlog questions.
Swiss Re and NN point to mixed insurance quality.
DT offers a solid telecom / capital return profile.
12. Tactical Takeaways
Area | Takeaway |
|---|---|
US equities | Index paused, but breadth improved sharply |
S&P ex-Mag7 | Strong catch-up / broadening signal |
Mag7 / Comm Services | Dragged the index lower |
Momentum / Data Centers | Still vulnerable after unwind |
Tech earnings | High bar; in-line not enough |
S&P earnings | Very strong, supports tactical bullish stance |
Siemens | Electrification strong; automation softer than hoped |
Rheinmetall | Divisional beat, but backlog / guidance concerns |
Swiss Re | Net income beat driven by L&H and lower cat |
NN Group | OCG modestly better; solvency beat methodology-driven |
DT | Solid print, FCF guide up, incremental buyback support |
Thursday’s US tape was weaker at the index level, with the S&P 500 down 17bps and the NDX down 83bps, but the underlying breadth was much better. S&P ex-Mag7 rose 215bps, Materials and Healthcare outperformed, and flows showed asset managers and hedge funds were still modest net buyers. This looks more like leadership rotation and Mag7 / momentum digestion than broad risk-off.
Earnings remain the central support for equities. S&P 500 Q2 EPS growth is tracking at 26% y/y excluding mega-cap tech “other income,” or 45% including those gains, while the median company is growing EPS by 12%, above the 9% pre-season expectation. That keeps the tactical bullish case intact.
The caveat is that Tech expectations are now very high. SNDK and WDC were punished despite broadly okay numbers, APP and HUBS sold off sharply on misses / guide-downs, while EXPE rallied on a clean beat-and-raise. The market is still rewarding fundamentals, but only where the bar is cleared convincingly.
In Europe, Siemens showed strong electrification but softer automation, Rheinmetall had strong divisional beats but backlog questions, Swiss Re’s beat was driven by L&H and lower cats, NN’s solvency beat was methodology-driven, and Deutsche Telekom delivered a solid print with additional buyback support.
Disclaimer: The material provided is for information purposes only and should not be considered as investment advice. The views, information, or opinions expressed in the text belong solely to the author, and not to the author’s employer, organization, committee or other group or individual or company.
Past performance is not indicative of future results.
High Risk Warning: CFDs are complex instruments and come with a high risk of losing money rapidly due to leverage. 69% and 73% of retail investor accounts lose money when trading CFDs with Tickmill UK Ltd and Tickmill Europe Ltd respectively. You should consider whether you understand how CFDs work and whether you can afford to take the high risk of losing your money.
Futures and Options: Trading futures and options on margin carries a high degree of risk and may result in losses exceeding your initial investment. These products are not suitable for all investors. Ensure you fully understand the risks and take appropriate care to manage your risk.
Patrick has been involved in the financial markets for well over a decade as a self-educated professional trader and money manager. Flitting between the roles of market commentator, analyst and mentor, Patrick has improved the technical skills and psychological stance of literally hundreds of traders – coaching them to become savvy market operators!